Major League Baseball is acknowledging that there has been more drag on the baseballs used in games this season, resulting in long fly balls traveling four feet less than they did a year ago.
The confirmation from MLB responded to a report by The Athletic, which reviewed fly ball and drag information available to the public. The review found that there has been more drag on the ball in 2025 than in any of the previous nine seasons during which MLB has tracked this data.
Advertisement
Those results would appear to indicate that the ball used this season is different. Yet no cause for the increase in drag has been determined. MLB says no intentional changes have been made to the baseballs, which are constructed by Rawlings at a factory in Costa Rica. (MLB purchased Rawlings in 2018.)
“We are aware of an increase in average drag this season and have provided information to the Major League Baseball Players Association on this issue as our experts continue to study any potential causes beyond normal variability in a product made by hand with natural materials,” MLB spokesperson Glen Caplin said in a statement to The Athletic.
“There has been no change to the manufacturing, storage or handling of baseballs this year, and all baseballs remain within specifications.”
The current theory is that there has been a slight change in seam width or height on the baseballs, which are hand-stitched. Yet that wouldn’t account for the league-wide change in drag on the ball.
MLB commissioner Rob Manfred has acknowledged the different results from baseballs this season during meetings with player representatives. The MLBPA has been in contact with the commissioner’s office to request information and monitor the issue, according to The Athletic.
Advertisement
Despite the difference in drag, MLB asserts that long fly ball numbers are “in line” with what they were last year after 978 games, or approximately 40% of the season. As a whole, batters are hitting the ball harder than they did overall, which might be overplaying the increased drag.
“MLB cited three statistics: home runs per ball in play were at 4.2 percent this year, compared to 4.1 percent in 2024; batting average was at .244, compared to .240; and runs per game were at 8.6, compared to 8.7.”
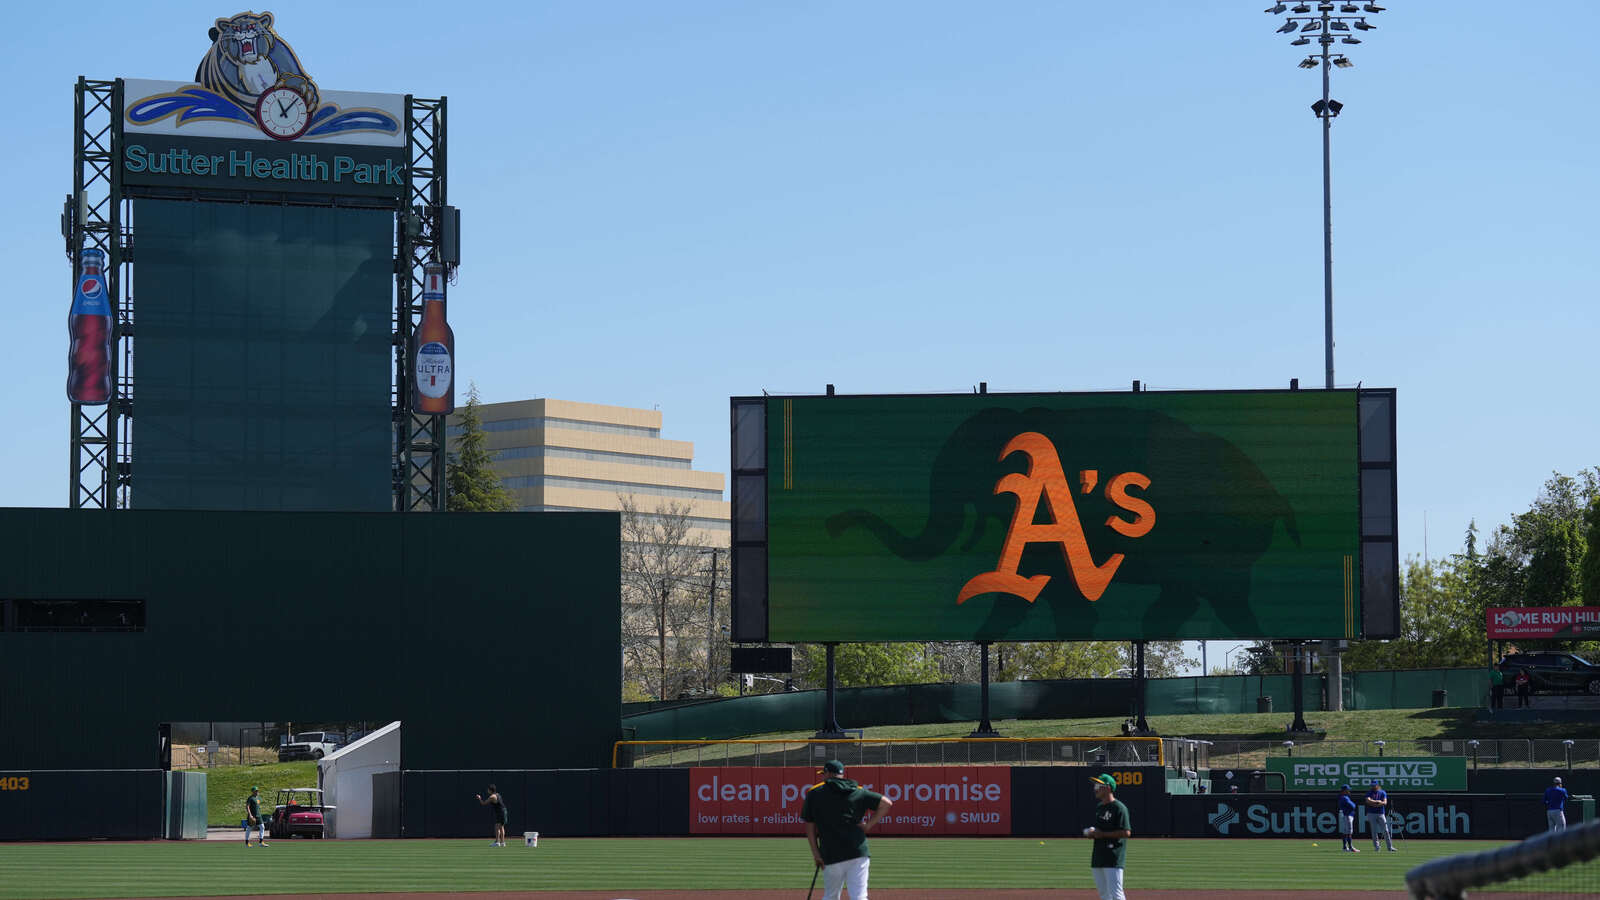
That data is taken from home runs at 28 of 30 ballparks this year, excluding the major-league games played at minor-league parks in Tampa, Florida, and Sacramento, California, this season
On an individual basis, Seattle Mariners catcher Cal Raleigh currently leads MLB with 26 home runs. Last year on June 13, New York Yankees slugger Aaron Judge had the top total at 25, the same number he has right now.